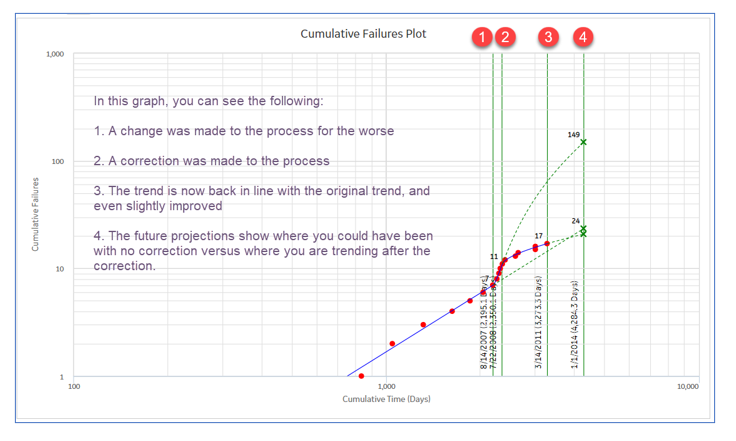
Reliability Growth Analyses are used to help you make strategic decisions by indicating whether your data measurements are random or if they follow a trend. Graphs produced by a Reliability Growth Analysis show any time-dependent trends, allowing you to evaluate past behavior and predict future behavior. After analyzing the results, you will be able to make strategic decisions to determine if a new or modified strategy will be effective in improving your reliability.
If data trends at the same rate over time without distinct changes, then you can use that trend to predict future behavior. If data trends in one direction up to a certain point in time, then you can examine what changed at that time and the impact of those changes. If you modify a strategy, then you can examine whether data worsens or improves from that point, to determine the impact of the change.
Trend charts can also show outlying events that may have had significant effects on the overall trend of strategy effectiveness. You have the option to ignore such events in a Reliability Growth Analysis.
